Interactive data on displacement in 2014 - 2015

This content has been created to present the data collected by the Monitoring System in relation to forced displacement due to violence for the period 2014-2015.


The following data is created as a graph with static data and five dashboards made in tableau. These dashboards are interactive, meaning that if you select any element of the graphs, your selection will act as a filter changing the data shown in that dashboard. Similarly, you can use the side panels where you can select among different options that we have made available. More about Tableau


You can interact with the data without risk of altering it. If you are confused, you can always clean the filters by reloading the page. Filters and interactions only affect the dashboard in which they are made.

FORCED DISPLACEMENT IN HONDURAS AND EL SALVADOR


Data from 2014 – 2015

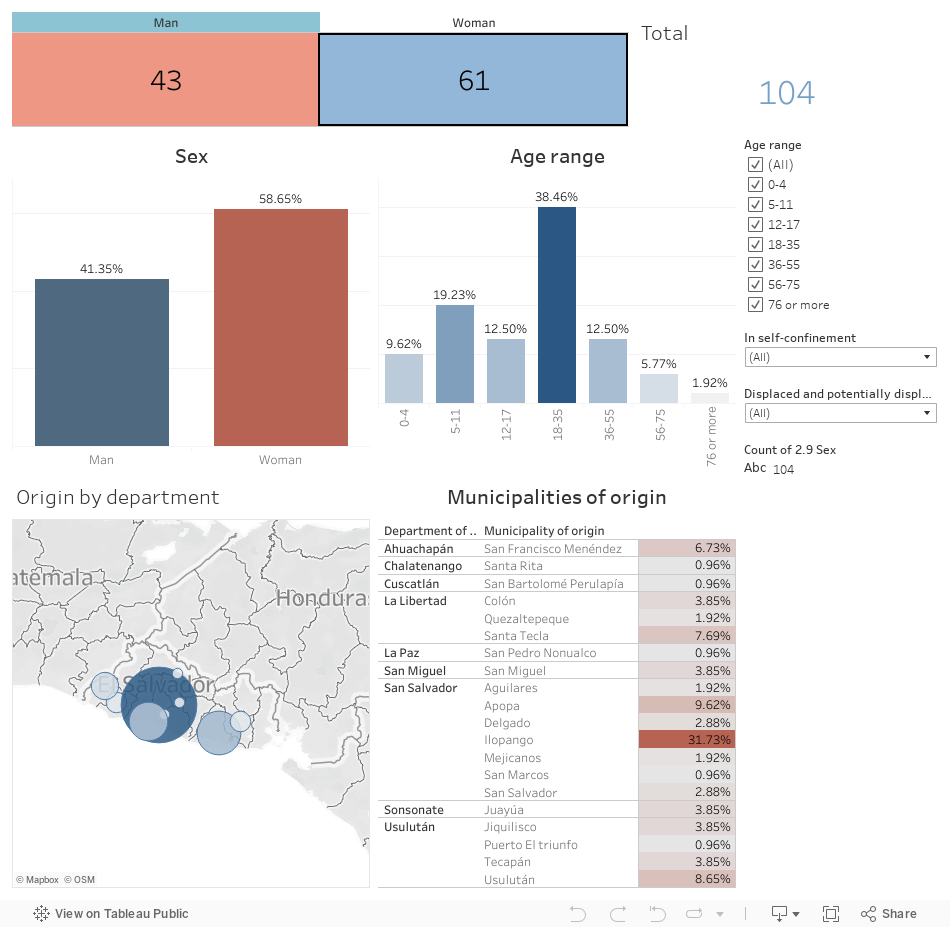
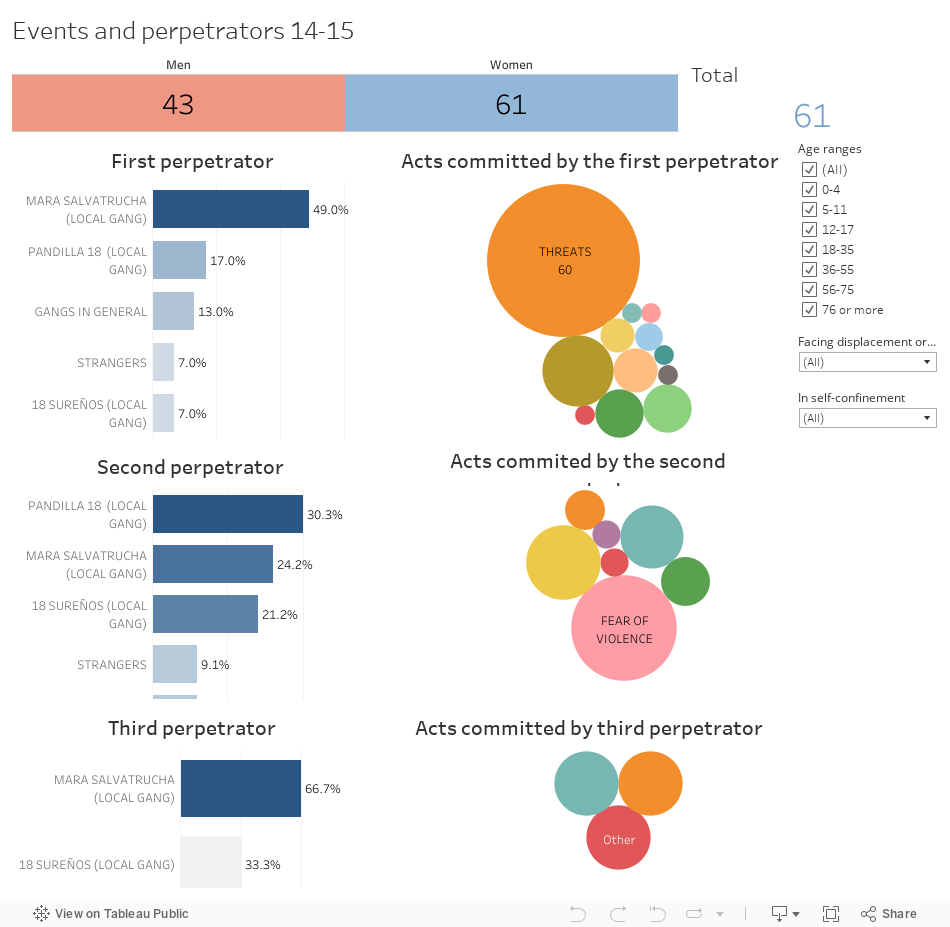
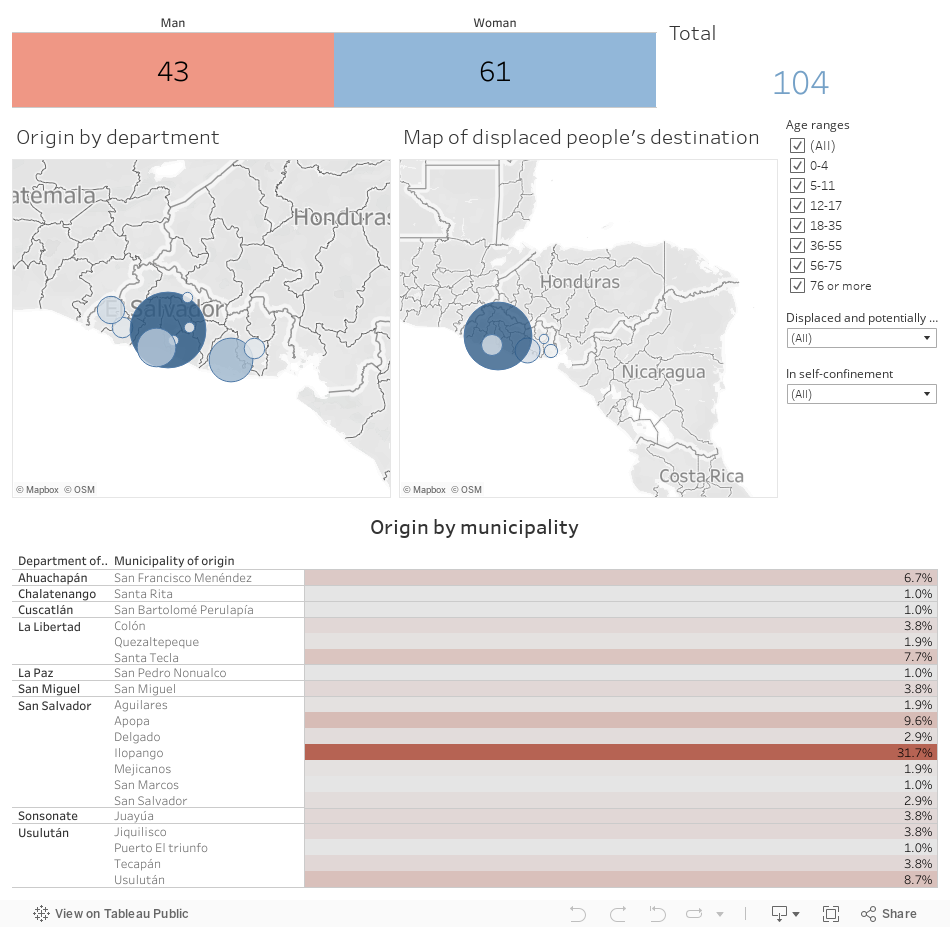
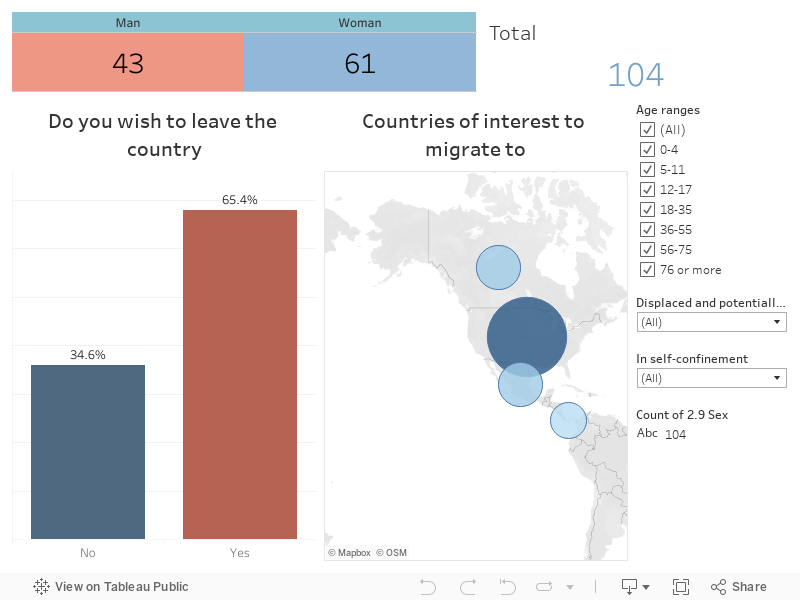
104 PEOPLE AFFECTED BY VIOLENCE FROM WHICH 81 ARE PEOPLE WHO HAVE FACED DISPLACEMENT


In the period 2014-2015, the Monitoring System identified 26 cases of forced displacement due to violence and a total of 104 people affected, of which, at the time of the interviews, 81 were displaced (77.9%) and 23 people were potentially facing displacement (22.1%).

All the cases were registered by Cristosal.


Please note: The data collected referring to 2014-2015 has been updated as new cases from those dates are discovered. Also, the data presented does not reflect a national or investigative sample; instead, this data is what that the monitoring system has been able to collect from participants who were interviewed or assisted by the organizations that are part of the system.

State institutions to which the complainants go.


Of the total number of people interviewed, only 15 filed complaints with State institutions, this is 20.3% of 74 people over 12 years of age. Data are only available for El Salvador.


The graph shows the State institutions that have received complaints from the people interviewed about the crimes that have caused forced displacement due to violence.

Sociodemographic data

The next panel collects all the sociodemographic data, showing information regarding sex, age, and country of origin of the people interviewed in El Salvador.


Please note: each panel is interactive, both within the graphs and within the filter panel on the right side. One of the filters refers to self-confinement, which we interpret as a situation in which people find themselves in the need to stay at home trying to safeguard their life. In addition, the data refers to 104 records of which more detailed information is available.

Data on victims and events


In this panel, the groups of perpetrators are identified by the acts they commit; Within the data collection that is carried out through interviews, three main events are identified and each event is related to a perpetrator. In this dashboard they have been placed in such a way that the events committed by each perpetrator can be identified. You are welcomed to use the available filters as you consider more interesting.

Origin and destination maps


The following panels identifies the place of origin and destination of people displaced due to violence, broken down by department and municipality. The place-of-origin map shows information on the places where the acts of violence that generated the displacement occurred, while the destination map shows the areas where people arrive after facing displacement. You can interact with the maps by department and show the places of origin and destination to visualize the way in which the population moves through the territories.


Please note: Some displaced people are not shown in the destination map because the data could not be obtained or because they have migrated.

Intentions when migrating


The System also collects information regarding the number of people who intend to migrate to another country, as well as the intended destination. The investigation found that 68 people (65.4%) had intentions to migrate.


Please note: in the destination country graph, of the 68 people who mentioned their intention to leave the country, only 53 (77.9%) stated where they were going.